Delivering value for Kiwis
Our reviews and reforms are estimated to deliver $236 million to $637 million in net benefits for New Zealanders over ten years

|
10 Sector reviews |
200+ Low-complexity reviews |
1,600+ Red Tape Tipline |
$436m Midpoint net benefit |
$11 Return per $1 invested |
$236 million – $637 million in benefits
We have estimated the net benefit of regulatory changes from our work initiated since March 2024 – from quick fixes to major regulatory reviews.
Twelve of our reviews have already led to regulatory changes. These changes alone have an estimated net public benefit of between $34.62 million and $94.04 million over 10 years.
Across 20 of our reviews that we've assessed, the estimated net public benefit is projected to be between $236 million and $637 million over ten years, with a midpoint of $436 million.
Every dollar invested in the Ministry is expected to deliver $6 to $17 in public benefit over 10 years, with a midpoint of $11.
The cost-benefit analyses underpinning these figures were subject to external conceptual review by economics and public policy institute, Motu Research.
What this means
Regulation affects almost every part of daily life, from the food we buy and the homes we live in to how we travel, access healthcare and run businesses.
The figures on this page estimate the net benefit of our work: what New Zealanders gain when unnecessary costs, delays and complexity are removed, while maintaining important protections. That can mean lower compliance costs for businesses, less paperwork for professionals, more choice for consumers and more efficient government.
By identifying and addressing opportunities for regulatory improvement, we aim to make it easier for New Zealanders to work, invest and innovate, while ensuring regulation remains effective, proportionate and fit for purpose.
Examples of impact






Where the value comes from
Some changes generate greater benefits than others. The chart below shows where most of the estimated net benefit from our work comes from.
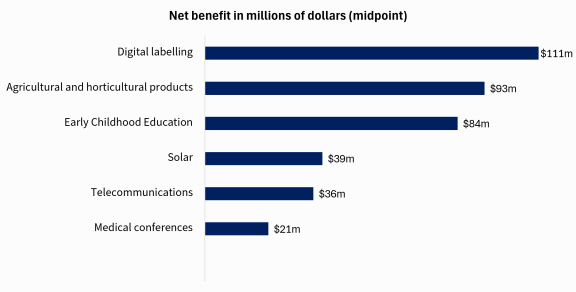
Horizontal bar chart of estimated net benefit (midpoint) of six of our regulatory reviews: Digital labelling $111m, agricultural and horticultural products $93m, early childhood education $84m, solar $39m, telecommunications $36m, medical conferences $21m.
Regulatory changes made
Legislation has passed, regulations have been amended, or guidance has been issued, meaning affected businesses, professionals and consumers can begin realising the benefits.

|
|
|
|
|
|
|
|
|
|
Anti-money laundering (property transactions) |
|
|
|
|
|
|
|
|
Nurse practitioners |
|
|
|
|
|
|
|
|
|
|
|
Small food manufacturers (cakes) |
|
|
Regulatory changes underway
Analysis has been completed and recommendations have been made, but implementation is still in progress. Benefits are expected to be realised once the proposed changes are adopted and come into effect.

|
|
|
|
|
|
|
|
|
|
|
|
|
|
|
|
|
|
|
|
|
|
Methodology and figures
Regulatory change already put into effect |
|||
|---|---|---|---|
| Lower bound ($m) | Midpoint ($m) | Upper bound ($m) | |
| Medical conferences | 6.18 | 20.67 | 35.15 |
| Flour dust standards | 6.13 | 12.53 | 18.93 |
| Nurse practitioners | 8.26 | 8.26 | 8.26 |
| Industrial hemp | 7.17 | 7.46 | 7.76 |
| Toy standards | 0.45 | 3.62 | 6.79 |
| Hairdressing and barbering | 6.51 | 6.51 | 6.51 |
| Small food manufacturers (cakes) | -0.60 | 2.78 | 6.15 |
| Offensive trades | 0.15 | 1.21 | 2.27 |
| Garden sheds | 0.13 | 0.87 | 1.62 |
| Buy now pay later | 0.22 | 0.32 | 0.42 |
| Anti-money laundering (property transactions) | 0.01 | 0.07 | 0.13 |
| AML compliance burden for gift cards | 0.02 | 0.03 | 0.05 |
| Total: | 34.62 | 64.33 | 94.04 |
Regulatory change ongoing |
|||
| Digital product labelling | 8.77 | 110.57 | 212.38 |
| Early childhood education | 48.83 | 84.44 | 120.05 |
| Agricultural and horticultural products | 93.06 | 93.06 | 93.06 |
| Telecommunications | 14.77 | 36.11 | 57.46 |
| Solar | 27.80 | 39.01 | 50.22 |
| Trout farming | 7.31 | 7.31 | 7.31 |
| Agricultural drones | 1.30 | 1.52 | 1.74 |
| Scaffolding | -0.32 | 0.10 | 0.51 |
| Total: | 201.52 | 372.12 | 542.72 |
| Overall total: | 236.14 | 436.45 | 636.75 |
- The analysis uses cost-benefit methodology, which monetises costs and benefits where possible.
- Simplifying assumptions were applied to keep the analysis manageable, without compromising rigour or transparency.
- Where assumptions were required, we erred on the side of conservatism to avoid overstating net benefits.
- Not all impacts could be monetised. Qualitative impacts were identified and analysed but excluded from the net benefit figures.
- These results do not necessarily indicate whether each regulatory change is welfare-enhancing overall; in some cases, further analysis would be required to make that determination.
- The exercise was undertaken on a best endeavours basis and was subject to data constraints, particularly for older proposals.
- Figures reported are rounded, but all calculations are made using unrounded numbers.