Red tape submissions quarterly report – 2024/25 Quarter 4 (1 April - 30 June 2025)
This is a quarterly report on the regulatory issues New Zealanders consider to be getting in the way of their lives and businesses.
This report is the third in this series and reports on red tape issues received through the red tape portalopen_in_new since its launch on 19 November 2024, as well as through other channels.
Key data highlights are shown below, and you can download the data source file in MS Excel here. (117 KB, Xlsx)
How many red tape submissions were received in Quarter 4 (1 April to 30 June 2025)?
The Ministry received 130 red tape submissions in Q4 24/25.
How many red tape submissions have been received this financial year?
Overall for FY24/25, 794 submissions have been received. We received:
-
27 submissions (3.4%) in Quarter 1 (July-Sept 2024)
-
459 submissions (57.8%) in Quarter 2 (Oct-Dec 2024)
-
178 submissions (22.4%) in Quarter 3 (Jan-March 2025)
-
130 submissions (16.3%) in Quarter 4 (April-June 2025)
Key themes identified in Quarter 4
We identify emergent themes for common issues after analysing submissions. Where we see themes emerging, we engage with the responsible agencies to understand whether reforms are underway that may address these issues or if we should investigate further. In some instances, a wider sector or system review may be warranted.
The key themes that emerged in FY24/25 were building consent and the Resource Management Act, traffic management, food regulation (especially for small businesses), anti-money laundering, and health and safety. These themes were generally reflected in the submissions received in Q4 24/25, with the addition of a number of submissions about swimming pools and building warrants of fitness.
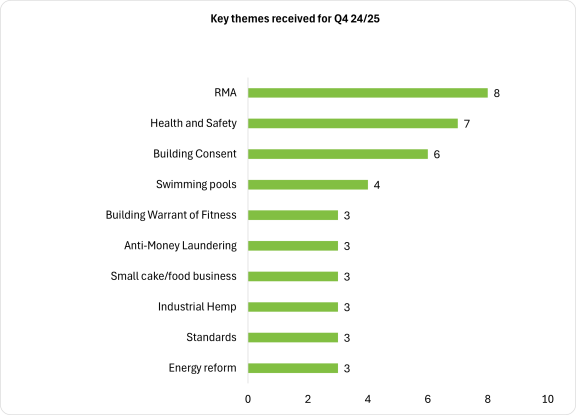
Bar chart showing key themes for submissions received during Quarter 4
| Theme | Count |
| RMA | 8 |
| Health and safety | 7 |
| Building consents | 6 |
| Swimming pools | 4 |
| Building warrant of fitness | 3 |
| Anti-money laundering | 3 |
| Small cake/ food business | 3 |
| Industrial hemp | 3 |
| Standards | 3 |
| Energy reform | 3 |
| Grand Total | 43 |
Key themes identified in FY 2024-2025
Key themes for submissions received for the year-to-date were:
- Building consent
- RMA
- Traffic management
- Small cake/ food business
- Anti money laundering
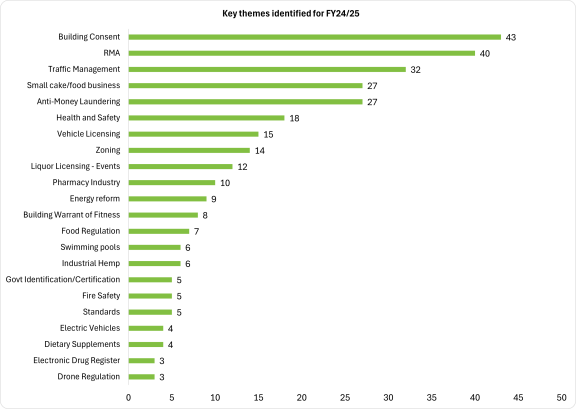
Column chart showing key themes for submissions received for the full 2024-2025 year.
| Theme | Count |
| Building Consent | 43 |
| RMA | 40 |
| Traffic Management | 32 |
| Anti-Money Laundering | 27 |
| Small cake/food business | 27 |
| Health and Safety | 18 |
| Vehicle Licensing | 15 |
| Zoning | 14 |
| Liquor Licensing - Events | 12 |
| Pharmacy Industry | 10 |
| Energy reform | 9 |
| Building Warrant of Fitness | 8 |
| Food Regulation | 7 |
| Industrial Hemp | 6 |
| Swimming pools | 6 |
| Standards | 5 |
| Fire Safety | 5 |
| Govt Identification/Certification | 5 |
| Dietary Supplements | 4 |
| Electric Vehicles | 4 |
| Drone Regulation | 3 |
| Electronic Drug Register | 3 |
| Grand Total | 303 |
Number of submissions received by industry sector for Quarter 4
Our analysis of industry sectors in Q4 2024/2025 indicate that construction, central government administration, healthcare, agriculture, forestry and fishing, and transport have the highest numbers of submissions.
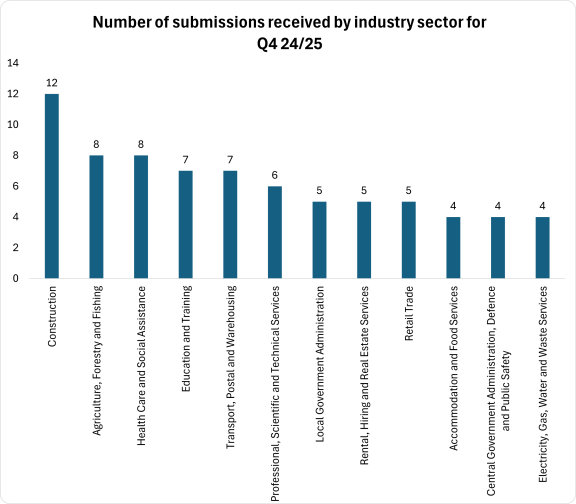
Column chart showing the number of submissions received by industry sector for Quarter 4
| ANZSIC06 Industry/Sector | Count |
| Other Services (not further specified) | 32 |
| Construction | 12 |
| Agriculture, Forestry and Fishing | 8 |
| Health Care and Social Assistance | 8 |
| Education and Training | 7 |
| Transport, Postal and Warehousing | 7 |
| Professional, Scientific and Technical Services | 6 |
| Local Government Administration | 5 |
| Rental, Hiring and Real Estate Services | 5 |
| Retail Trade | 5 |
| Accommodation and Food Services | 4 |
| Central Government Administration, Defence and Public Safety | 4 |
| Electricity, Gas, Water and Waste Services | 4 |
| Other industries (combined) | 14 |
| Not reported | 9 |
| Grand Total | 130 |
Number of submissions received by industry sector for FY 2024-2025
The industry sectors most often selected by submitters for the year-to-date were:
- Construction (13.6%)
- Central Government Administration, Defence & Public Safety (8.1%)
- Health Care and Social Assistance (6.3%)
- Agriculture, Forestry and Fishing (5.8%)
- Transport, Postal, and Warehousing (5.5%)
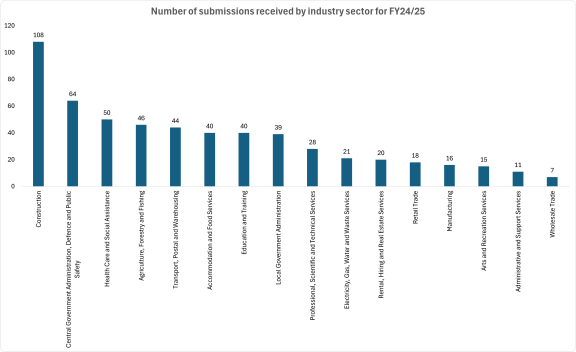
Column chart showing the number of submissions received by industry sector for year-to-date.
| ANZSIC06 Industry/Sector | Count |
| Other Services (not further specified) | 152 |
| Construction | 108 |
| Central Government Administration, Defence and Public Safety | 64 |
| Health Care and Social Assistance | 50 |
| Agriculture, Forestry and Fishing | 46 |
| Transport, Postal and Warehousing | 44 |
| Accommodation and Food Services | 40 |
| Education and Training | 40 |
| Local Government Administration | 39 |
| Professional, Scientific and Technical Services | 28 |
| Electricity, Gas, Water and Waste Services | 21 |
| Rental, Hiring and Real Estate Services | 20 |
| Retail Trade | 18 |
| Manufacturing | 16 |
| Arts and Recreation Services | 15 |
| Administrative and Support Services | 11 |
| Wholesale Trade | 7 |
| Other industries (combined) | 14 |
| Not reported | 61 |
| Grand Total | 794 |
Completed interventions for Q4
We screen and/or triage all the submissions we receive and consider carefully how they are best addressed.
(Note that the charts below include only issues that were investigated and where our interventions were completed).
For Quarter 4 2024/25, we progressed 50 issues for investigation. We have completed our interventions on 198 submissions.
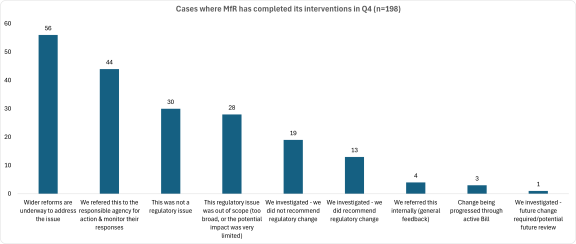
Column chart showing what have we done with the submissions. Cases where we completed our interventions in Q4 2024-2025.
| MfR Intervention Complete - Reasons | Count |
| Wider reforms are underway to address the issue | 56 |
| We referred this to the responsible agency for action & monitor their responses | 44 |
| This was not a regulatory issue | 30 |
| This regulatory issue was out of scope (too broad, or the potential impact was very limited) | 28 |
| We investigated - we did not recommend regulatory change | 19 |
| We investigated - we did recommend regulatory change | 13 |
| We referred this internally (general feedback) | 4 |
| Change being progressed through active Bill | 3 |
| We investigated - future change required/potential future review | 1 |
| Grand Total | 198 |
Completed interventions for FY 2024-2025
Overall for FY24/25, we progressed 266 issues (33.5% of those received) for investigation. We have completed interventions on 627 submissions (79.0%) this financial year.
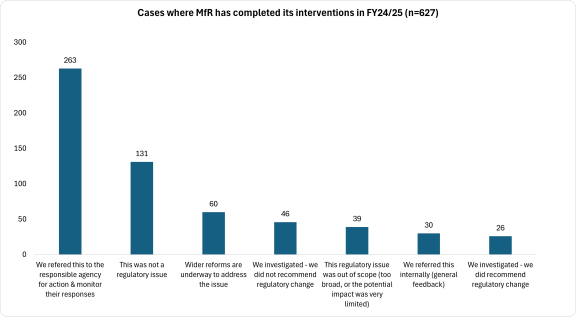
Column chart showing what have we done with the submissions. Cases where MfR has completed its interventions year-to-date.
| MfR Intervention Complete - Reasons | Count |
| We referred this to the responsible agency for action & monitor their responses | 263 |
| This was not a regulatory issue | 131 |
| Wider reforms are underway to address the issue | 60 |
| We investigated - we did not recommend regulatory change | 46 |
| This regulatory issue was out of scope (too broad, or the potential impact was very limited) | 39 |
| We referred this internally (general feedback) | 30 |
| We investigated - we did recommend regulatory change | 26 |
| Change being progressed through active Bill | 26 |
| We investigated - future change required/potential future review | 6 |
| Grand Total | 627 |
What were the outcomes for our completed interventions?
For Q4 we recommended regulatory change for 13 submissions and recommended one submission for a potential future review following our intervention. For FY24/25 we recommended regulatory change for 26 submissions and recommended six for a potential future review. More information about some of these changes can be found on our website: What we've done.
In Q4 we referred 44 submissions to the responsible agencies. Around a third of all submissions considered in FY 24/25, 263 (42%) were referred to the responsible agency. We work actively with the responsible agencies to understand how they will work with the submitters to resolve the issues raised.
We also build our understanding of the reform work responsible agencies already have underway that might address these concerns, and drive and influence further change when required. This allows us to actively work and co-ordinate action across a broad range of regulatory systems.
Not everything reported to us is a regulatory issue. Thirty submissions we received in Q4 were deemed to be not a regulatory issue. For FY24/25, 131 (21%) of the submissions we received in the year were not issues related to regulation. In these cases, we advise submitters that their submission is not a regulatory issue (and point them to information about what regulatory issues are or let them know about other places to raise their concerns).
If there is already a government intervention underway, like a new law or amendment that will address the concern, we let submitters know how to engage with that process.
Which agencies did we work with?
We work actively with other government agencies and co-ordinate action across a broad range of regulatory systems to identify where issues are arising and how agencies can work with us to address them. Submissions may be referred to more than one relevant agency.
We referred 43 issues to other agencies in Q4 24/25. Overall we referred 262 issues in FY2024/25.
(Note the referral totals in the tables below do not add up to these total numbers because some issues are referred to more than one agency. Note that this data records the initial agencies where submissions are referred not any subsequent transfer to responsible agencies).
Number of referrals made to responsible agencies in Quarter 4 2024-2025
For Q4 24/25, the top 5 agencies we worked with were:
- Ministry of Business, Innovation and Employment
- Ministry for the Environment
- WorkSafe New Zealand
- Department of Internal Affairs
- New Zealand Transport Agency - Waka Kotahi, tied with the Inland Revenue Department
This reflects the key themes we have seen emerging from the submissions (Building System and the Resource Management Act, traffic management, food regulation (especially for small businesses), anti-money laundering, and health and safety).
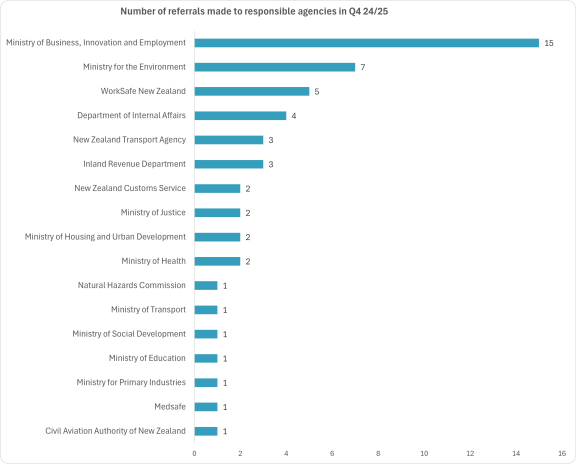
Bar chart showing shows how many referrals were made to responsible agencies in Quarter 4.
| Responsible Agency | Count |
| Ministry of Business, Innovation and Employment | 15 |
| Ministry for the Environment | 7 |
| WorkSafe New Zealand | 5 |
| Department of Internal Affairs | 4 |
| Inland Revenue Department | 3 |
| New Zealand Transport Agency | 3 |
| Ministry of Health | 2 |
| Ministry of Housing and Urban Development | 2 |
| Ministry of Justice | 2 |
| New Zealand Customs Service | 2 |
| Civil Aviation Authority of New Zealand | 1 |
| Medsafe | 1 |
| Ministry for Primary Industries | 1 |
| Ministry of Education | 1 |
| Ministry of Social Development | 1 |
| Ministry of Transport | 1 |
| Natural Hazards Commission | 1 |
| Grand Total | 52 |
Number of referrals made to responsible agencies for FY 2024-2025
Overall, for the FY24/25 year, the top 5 agencies we worked with, were:
- Ministry of Business, Innovation and Employment
- Ministry for the Environment
- Ministry of Transport
- New Zealand Transport Agency - Waka Kotahi
- Department of Internal Affairs
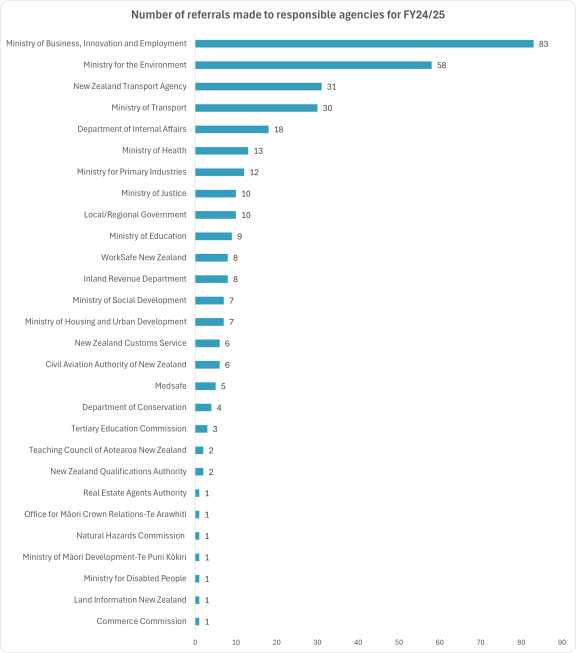
Bar chart showing shows how many referrals were made to responsible agencies for full year 2024-2025.
| Responsible Agency | Count |
| Ministry of Business, Innovation and Employment | 83 |
| Ministry for the Environment | 58 |
| New Zealand Transport Agency | 31 |
| Ministry of Transport | 30 |
| Department of Internal Affairs | 18 |
| Ministry of Health | 13 |
| Ministry for Primary Industries | 12 |
| Local/Regional Government | 10 |
| Ministry of Justice | 10 |
| Ministry of Education | 9 |
| Inland Revenue Department | 8 |
| WorkSafe New Zealand | 8 |
| Ministry of Housing and Urban Development | 7 |
| Ministry of Social Development | 7 |
| Civil Aviation Authority of New Zealand | 6 |
| New Zealand Customs Service | 6 |
| Medsafe | 5 |
| Department of Conservation | 4 |
| Tertiary Education Commission | 3 |
| New Zealand Qualifications Authority | 2 |
| Teaching Council of Aotearoa New Zealand | 2 |
| Commerce Commission | 1 |
| Land Information New Zealand | 1 |
| Ministry for Disabled People | 1 |
| Ministry of Māori Development-Te Puni Kōkiri | 1 |
| Natural Hazards Commission | 1 |
| Office for Māori Crown Relations-Te Arawhiti | 1 |
| Real Estate Agents Authority | 1 |
| Grand Total | 339 |
Where Quarter 4 submissions came from
The regions identified by submitters most often during Q4 24/25 were:
- Wellington (24.6%)
- Canterbury (16.2%)
- Auckland (13.8%)
- Other North Island Locations (10.7%)
- Waikato (8.5%)
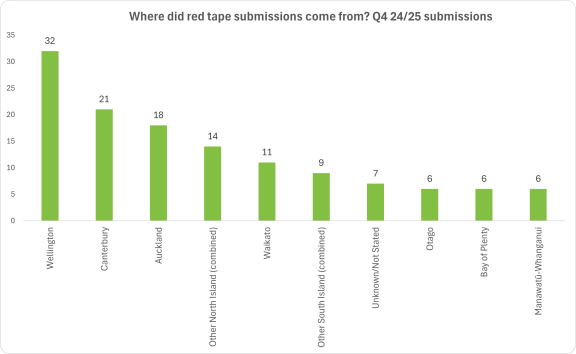
Column chart showing where red tape submissions came from in Q4.
| Submitter Location | Count |
| Wellington | 32 |
| Canterbury | 21 |
| Auckland | 18 |
| Other North Island (combined) | 14 |
| Waikato | 11 |
| Other South Island (combined) | 9 |
| Unknown/Not Stated | 7 |
| Otago | 6 |
| Bay of Plenty | 6 |
| Manawatū-Whanganui | 6 |
| Grand Total | 130 |
Where submissions for FY 2024-2025 came from
The regions identified by submitters most often overall for FY24/25 were:
Auckland (22.5%)
Wellington (17.4%)
Canterbury (13.0%)
Waikato (7.9%)
Bay of Plenty (5.0%)
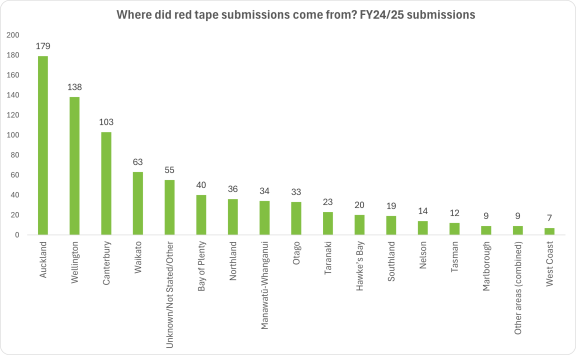
Column chart showing where red tape submissions come from for the year-to-date
Notes:
The submissions for Quarters 1-3 of the 2024/25 financial year were received during the period 1 July 2024 - 31 March 2025. However we did not launch the red tape online submission portal until 19 November 2024.
Accordingly, not all submitters have provided their location information. Submissions received prior to 19 November 2024, or submissions received via another channel many not include location information.
| Submitter Location | Count |
| Auckland | 179 |
| Wellington | 138 |
| Canterbury | 103 |
| Waikato | 63 |
| Unknown/Not Stated/Other | 55 |
| Bay of Plenty | 40 |
| Northland | 36 |
| Manawatū-Whanganui | 34 |
| Otago | 33 |
| Taranaki | 23 |
| Hawke’s Bay | 20 |
| Southland | 19 |
| Nelson | 14 |
| Tasman | 12 |
| Marlborough | 9 |
| Other areas (combined) | 9 |
| West Coast | 7 |
| Grand Total | 794 |
Who made submissions in Quarter 4?
In Q4 24/25, we received 89 (68.5%) submissions from individuals and 38 (29.2%) submissions that were made on behalf of an organisation. Three (2.3%) came from other sources.
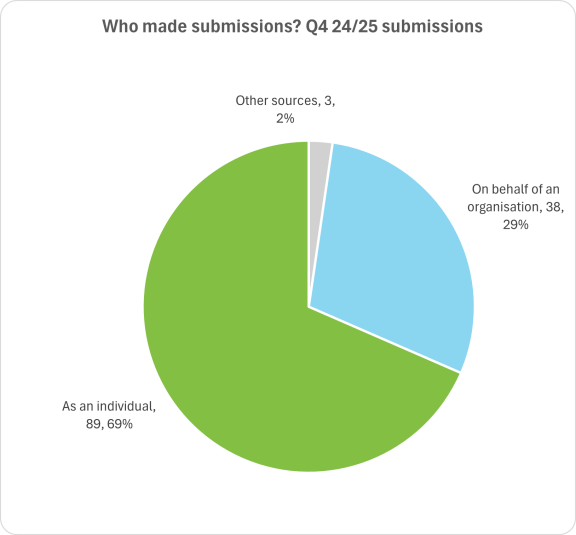
Pie chart showing who made submissions in Q4.
| Submitter is individual or organisation | Count |
| As an individual | 89 |
| On behalf of an organisation | 38 |
| Other sources | 3 |
| Grand Total | 130 |
Who made submissions in FY 2024-2025?
Overall for FY24/25 we received 580 (73.0%) submissions from individuals and 188 (23.7%) submissions made on behalf of an organisation. 26 submissions (3.3%) came from other sources.
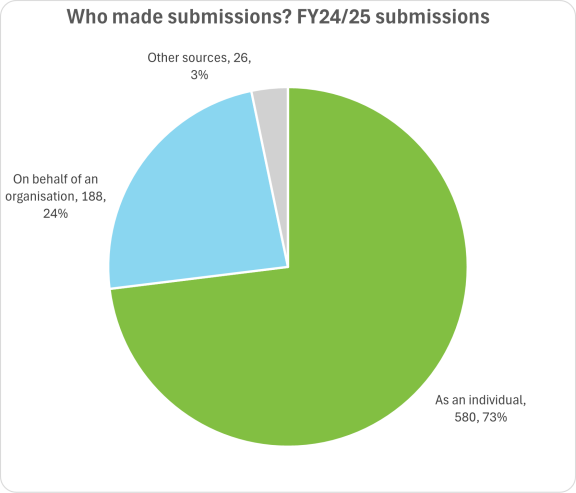
Pie chart showing who made submissions for the full 2024-2025 year.
| Submitter is individual or organisation | Count |
| As an individual | 580 |
| On behalf of an organisation | 188 |
| Other sources | 26 |
| Grand Total | 794 |