Red tape submissions quarterly report – FY 2025/26 Quarter 1 (1 July - 30 September 2025)
This is a quarterly report on the regulatory issues New Zealanders consider to be getting in the way of their lives and businesses.
This report is the fourth in this series and reports on red tape issues received through the red tape tiplineopen_in_new since its launch on 19 November 2024. Key data highlights are shown below.
How many red tape submissions were received in Quarter 1?
We received 484 submissions in Quarter 1 of FY 2025/2026.
Key themes identified in Q1 FY 2025/26
We identify emergent themes for common issues after analysing submissions. Where we see themes emerging, we engage with the responsible agencies to understand whether reforms are underway that may address these issues or if we should investigate further. In some instances, a wider sector or system review may be warranted.
Key themes for submissions received during Quarter 1 2025/26 were:
- Resource Management Act (RMA) 24%
- Building Consents 18%
- Local Government Practice 14%
- Vehicle Licensing 4%.
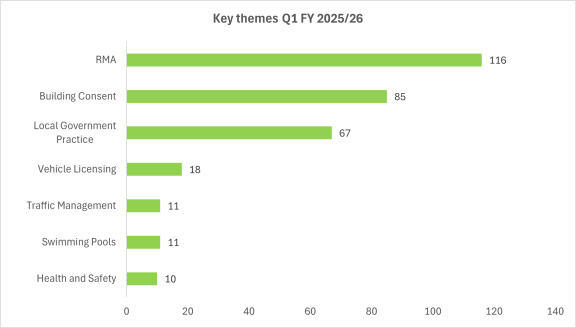
Bar chart showing key themes for submissions received during Quarter 1.
|
Theme |
Count |
| RMA | 116 |
| Building Consent | 85 |
| Local Government Practice | 67 |
| Vehicle Licensing | 18 |
| Swimming Pools | 11 |
| Traffic Management | 11 |
| Health and Safety | 10 |
Number of submissions received by industry sector for Q1 FY 2025/26
There were a relatively higher number of submissions related to the following industry sectors: Construction, Other Services, Local Government Administration, and Transport, Postal and Warehousing.
Submitters who identified ‘Other services’ as the related industry or sector submitted on a diverse range of services including financial and legal sectors, government and community services, trade, tourism and entertainment.
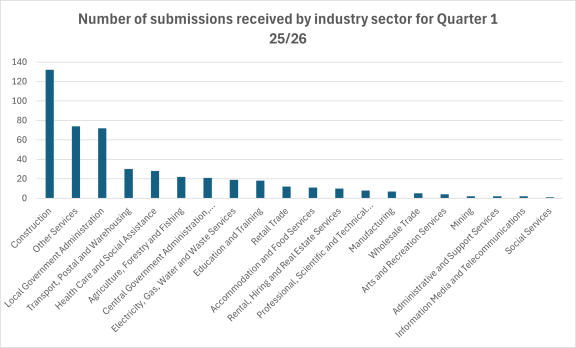
Column chart showing the number of submissions received by industry sector for Quarter 4
|
Related industry |
Count |
Percent |
|
Construction |
132 |
27% |
|
Other Services |
74 |
15% |
|
Local Government Administration |
72 |
15% |
|
Transport, Postal and Warehousing |
30 |
6% |
|
Health Care and Social Assistance |
28 |
6% |
|
Agriculture, Forestry and Fishing |
22 |
5% |
|
Central Government Administration, Defence and Public Safety |
21 |
4% |
|
Electricity, Gas, Water and Waste Services |
19 |
4% |
|
Education and Training |
18 |
4% |
|
Retail Trade |
12 |
2% |
|
Accommodation and Food Services |
11 |
2% |
|
Rental, Hiring and Real Estate Services |
10 |
2% |
|
Professional, Scientific and Technical Services |
8 |
2% |
|
Manufacturing |
7 |
1% |
|
Wholesale Trade |
5 |
1% |
|
Arts and Recreation Services |
4 |
1% |
|
Mining |
2 |
0% |
|
Administrative and Support Services |
2 |
0% |
|
Information Media and Telecommunications |
2 |
0% |
|
Social Services |
1 |
0% |
|
Hairdressing and barbering |
1 |
0% |
|
Total |
481 |
What have we done with the submissions?
We screen all the submissions we receive and consider carefully how they are best addressed. In Q1 FY 2025/26, we progressed 99 issues for further review.
This quarter have completed our interventions on 140 submissions. This includes issues that were progressed for further work prior to Q1 FY 2025/2026.
What were the outcomes for our completed interventions?
Completed interventions can result in referrals and recommendations to other agencies, consideration for future reviews, or recommendations for regulatory change. We also use the submissions we receive through the tipline to build our understanding of the performance of regulatory systems and where people are experiencing challenges. This generates insights which supports our stewardship work, and can be passed on to agencies responsible for the subject matter.
In Q1 we recommended regulatory change in seven areas. As recommendations can relate to multiple submissions, a total of 20 submissions resulted in a regulatory change recommendation.
We also use submissions to build our understanding of the reform work responsible agencies already have underway that might address these concerns, and drive and influence further change when required. This allows us to actively work and co-ordinate action across a broad range of regulatory systems.
Working with other agencies
As part of reviewing regulatory issues we work actively with other agencies where issues fall within the portfolio responsibilities of their Ministers. We engage with agencies with subject expertise while reviewing issues.
Where our conclusions or insights can support other agencies in their regulatory stewardship functions we will provide these to the relevant agency. We may provide information relating to issues which cross multiple regulatory systems, or where the Ministry of Regulation can provide value.
We work actively with these agencies and co-ordinate action across a broad range of regulatory systems, identify where issues are arising and how agencies can work with us to address them.
Where did red tape submissions in Q1 come from?
The regions identified by submitters most often during Q1 25/26 were:
- Auckland (25%)
- Canterbury (16%)
- Wellington (14%)
- Waikato (10%).
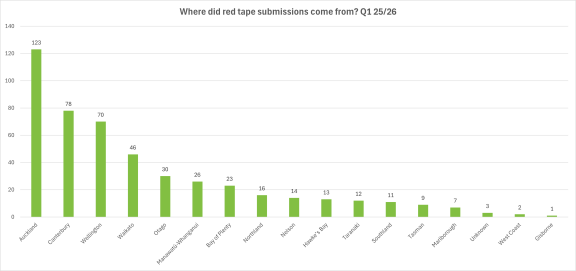
Column chart showing which regions submitters came from in Quarter 1.
| Locations | Count |
| Auckland | 123 |
| Canterbury | 78 |
| Wellington | 70 |
| Waikato | 46 |
| Otago | 30 |
| Manawatū-Whanganui | 26 |
| Bay of Plenty | 23 |
| Northland | 16 |
| Nelson | 14 |
| Hawke’s Bay | 13 |
| Taranaki | 12 |
| Southland | 11 |
| Tasman | 9 |
| Marlborough | 7 |
| Unknown | 3 |
| West Coast | 2 |
| Gisborne | 1 |
| Total | 484 |
Who made submissions?
In Quarter 1, 410 submissions (85%) came from individuals, while 74 submissions (15%) were made on behalf of organisations.
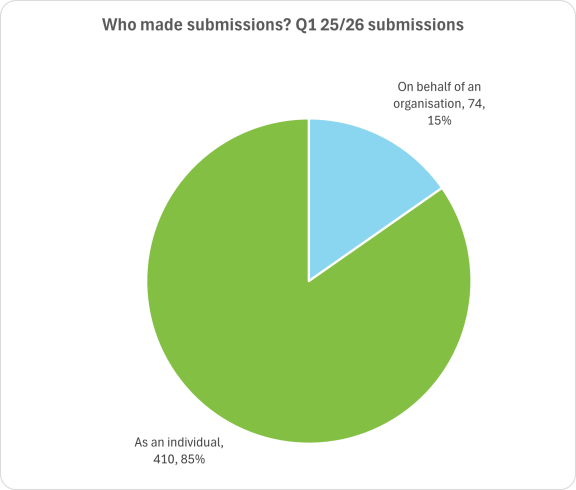
Pie chart showing numbers of individudal submissions vs on behalf of an organisation.
| Submitter is individual or organisation | Count |
| On behalf of an organisation | 74 |
| As an individual | 410 |
| Grand Total | 484 |